Using monitoring tables & trace/audit for system analysis
Pavel Císař, IBPhoenix
Firebird Conference 2014, Prague

Pavel Císař, IBPhoenix
Firebird Conference 2014, Prague
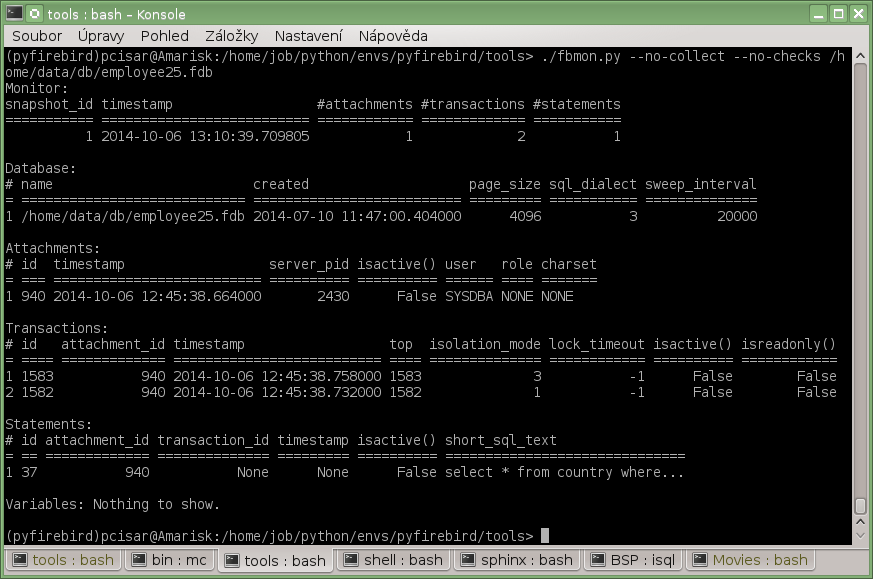
ATTACHMENT_ID
TRANSACTION_ID
TIMESTAMP
Upper limit used by the sweeper when advancing the global OIT. Transactions above this threshold are considered active. It is normally equivalent to the TRANSACTION_ID but COMMIT/ROLLBACK RETAINING will cause TOP_TRANSACTION to remain unchanged (“stuck”).
ISOLATION_MODE
LOCK_TIMEOUT
READ_ONLY
Columns TRANSACTION_ID and TIMESTAMP contain valid values for active statements only.
Colum SQL_TEXT is empty for BLR requests (for example some from ISQL).
Not very interesting/useful.
Useful in rare cases when long runing SQL statement is PSQL and you want to know where exactly is stuck in call chain.
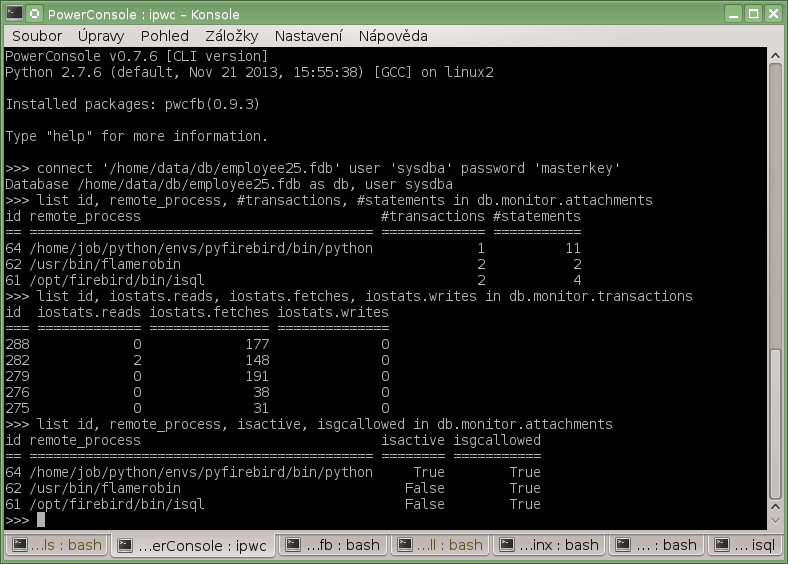
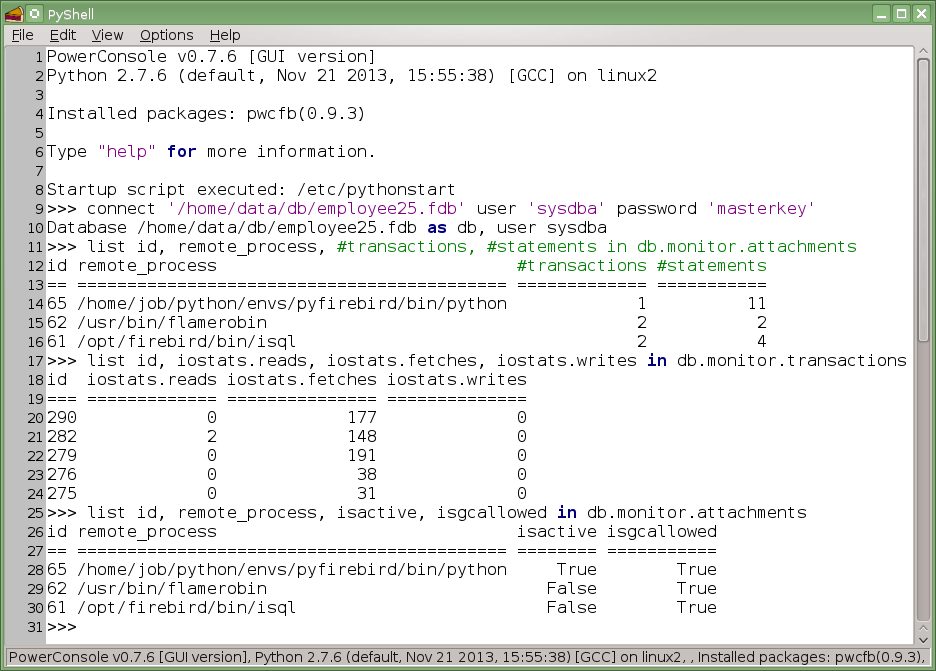
PAGE_READS (number of page reads)
PAGE_WRITES (number of page writes)
PAGE_FETCHES (number of page fetches)
PAGE_MARKS (number of pages with changes pending)
STAT_GROUP
High-level memory allocations performed by the engine from its pools. Can be useful for tracing memory leaks and for investigating unusual memory consumption and the attachments, procedures, etc. that might be responsible for it.
Low-level memory allocations performed by the Firebird memory manager. These are bytes actually allocated by the operating system, so it enables the physical memory consumption to be monitored.
Not all records have non-zero values. On the whole, only MON$DATABASE and memory-bound objects point to non-zero “allocated” values. Small allocations are not allocated at this level, being redirected to the database memory pool instead.
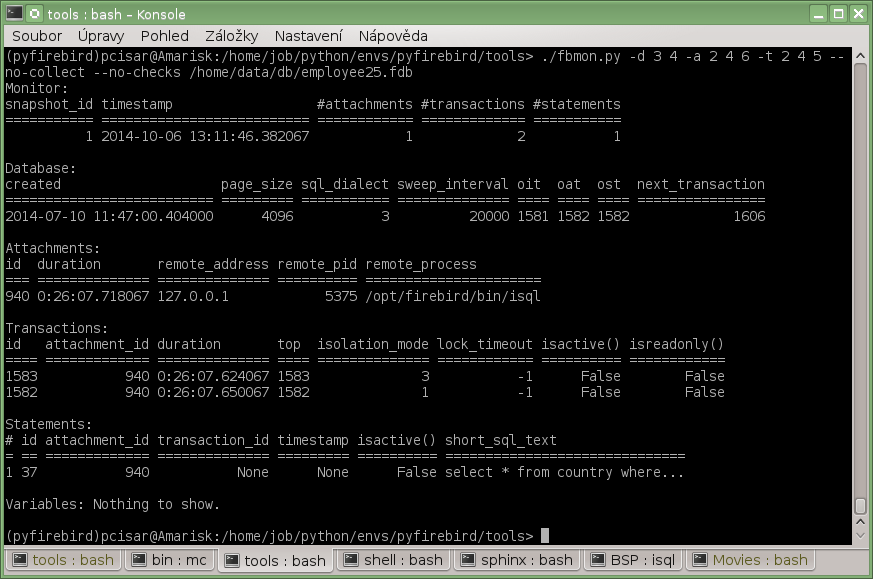
[transactions]
; 'collect' : default columns
collect   = row_id as #, id, attachment.id, timestamp, top,
            isolation_mode,  lock_timeout, isactive(),
            isreadonly()
; 'collect_x' : numbered column groups
collect_1 = snapshot.id, snapshot.timestamp
collect_2 = id, attachment.id
collect_3 = timestamp
collect_4 = snapshot.timestamp - this.timestamp as duration
collect_5 = top, isolation_mode, lock_timeout, isactive(), isreadonly()
collect_6 = count(statements), count(variables)
collect_7 = iostats.backouts, iostats.purges, iostats.expunges
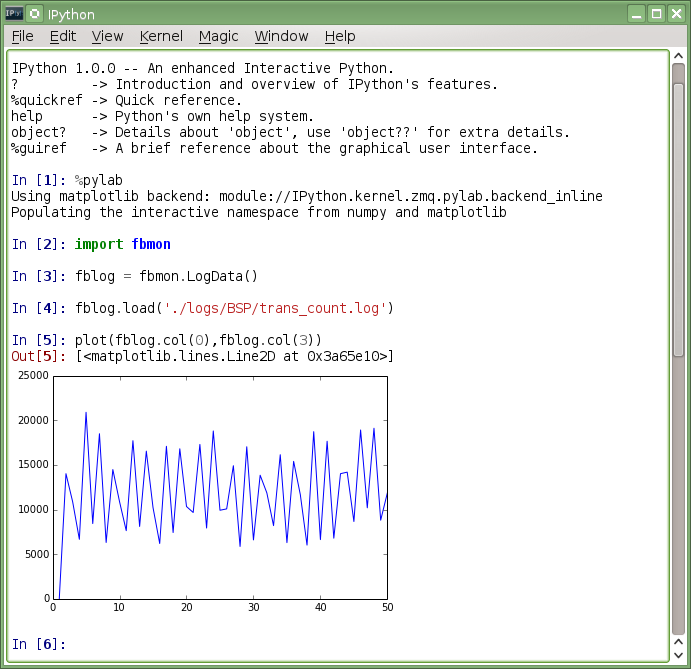
[log_trans_count]
dataset  = db
collect  = snapshot.id, snapshot.timestamp, next_transaction,
           diff(next_transaction) as trans_count
filename = %(tr_logs)s/trans_count.log
format   = list
mode     = append_rotate

[log_statement_count]
dataset  = monitor
collect  = snapshot.id, snapshot.timestamp,
           count(this.statements) as st_count,
           count([x for x in this.statements
                  if not x.transaction]) as pr_count
filename = %(here)s/st_count.log
format   = csv_hdr
mode     = append_rotate
[check_long_running_transaction]
dataset = transactions
; Report any trans. longer than 60 minutes but do not report OAT
check   = (vars.oat.id != this.id) and
          (snapshot.timestamp > this.timestamp +
           datetime.timedelta(minutes=60))
vars    = mon.get_transaction(mon.db.oat) as oat
actions = report
message = "Long running transaction %%d (%%s) from %%s:%%s" %%
          (this.id, snapshot.timestamp - this.timestamp,
           this.attachment.remote_address,
           this.attachment.remote_process)

[check_sweep]
dataset = db
check   = (this.sweep_interval == 0) and
          (this.ost - this.oit >= 100000)
actions = sweep, report
message = "Manual sweep needed (gap %%d)" %% (this.ost - this.oit)
[action_sweep]
class    = program
run_mode = async
command  = /opt/firebird/bin/gfix -sweep -user %(user)s
           -password %(password)s %(database)s
calm     = 10

[action_alert]
class    = report
template = ALERT: %%(message)s
remind   = 5

[action_terminate_client]
class   = terminate
mode    = attachment
delay   = 10
timeout = 1
2014-05-28T11:21:04.2360 (5776:0000ED5470) EXECUTE_PROCEDURE_FINISH
TEST_DB (ATT_10, SERVER:NONE, ISO88591, TCPv4:192.168.1.5)
D:\TEST_DB\App\app.exe:2644
(TRA_1596, READ_COMMITTED | REC_VERSION | WAIT | READ_WRITE)
Procedure SOMEPROC:
param0 = varchar(10), "XXX"
param1 = double precision, "313210"
param2 = double precision, "24"
param3 = integer, "3"
1 ms, 15 fetch(es)
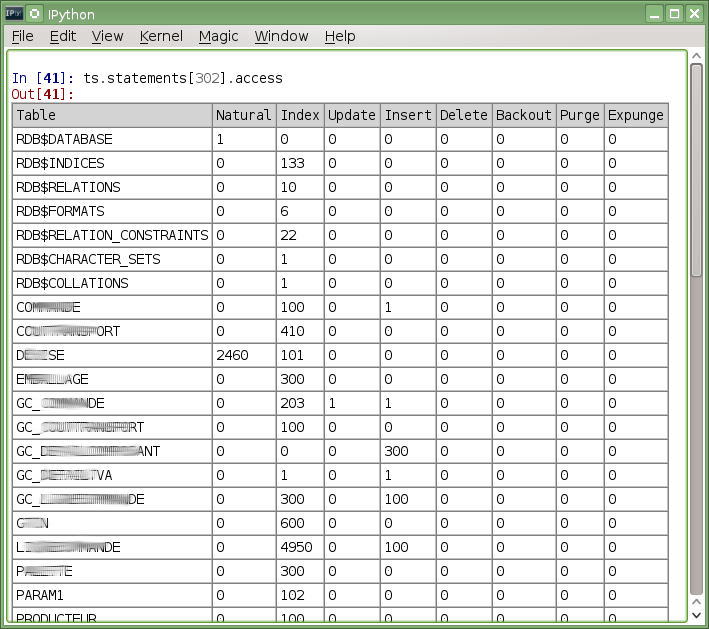
Table Natural Index Update Insert Delete Backout Purge Expunge
*******************************************************************
TABLE_001 1
TABLE_002 1
TABLE_003 1
2014-05-28T11:21:03.4560 (5776:0000000000ED67A0) TRACE_INIT
      SESSION_1 Firebird Audit

--- Session 1 is suspended as its log is full ---
2014-05-23T11:01:24.8080 (3720:0000000000EFD9E8) TRACE_INIT
      SESSION_1

2014-05-23T11:01:24.8080 (3720:0000000000EFD9E8) TRACE_FINI
      SESSION_1
2014-05-28T11:21:03.4870 (5776:0000000000ED5470) ATTACH_DATABASE
      TEST_DB (ATT_10, SERVER:NONE, ISO88591, TCPv4:192.168.1.5)
      D:\TEST\App\MyApp.exe:2644

2014-09-24T14:46:15.0350 (2453:2a04910) UNAUTHORIZED ATTACH_DATABASE
      /home/db/employee25.fdb (ATT_0, sysdba, NONE, TCPv4:127.0.0.1)
      /opt/firebird/bin/isql:8723

2014-05-23T11:01:24.8080 (3720:0000000000EFD9E8) DETACH_DATABASE
      TEST_DB (ATT_8, SERVER:NONE, ISO88591, TCPv4:192.168.1.5)
      D:\TEST\App\MyApp.exe:6072
2014-05-23T11:00:28.6160 (3720:0000000000EFD9E8) START_TRANSACTION
      TEST_DB (ATT_8, SERVER:NONE, ISO88591, TCPv4:192.168.1.5)
      D:\TEST\App\MyApp.exe:6072
        (TRA_1568, READ_COMMITTED | REC_VERSION | WAIT | READ_WRITE)

2014-05-23T11:00:29.9570 (3720:0000000000EFD9E8) COMMIT_TRANSACTION
      TEST_DB (ATT_8, SERVER:NONE, ISO88591, TCPv4:192.168.1.5)
      D:\TEST\App\MyApp.exe:6072
        (TRA_1568, READ_COMMITTED | REC_VERSION | WAIT | READ_WRITE)
    0 ms, 1 read(s), 1 write(s), 1 fetch(es), 1 mark(s)
2014-05-28T11:21:03.7680 (5776:0000000000ED5470) PREPARE_STATEMENT
      TEST_DB (ATT_10, SERVER:NONE, ISO88591, TCPv4:192.168.1.5)
      D:\TEST\App\MyApp.exe:2644
        (TRA_1596, READ_COMMITTED | REC_VERSION | WAIT | READ_WRITE)

Statement 110:
-------------------------------------------------------------------------------
EXECUTE PROCEDURE PROC_001('37720', '3', '1', 'LIL')
  269 ms
2014-05-28T11:21:03.7680 (5776:0000ED5470) EXECUTE_TRIGGER_START
      TEST_DB (ATT_10, SERVER:NONE, ISO88591, TCPv4:192.168.1.5)
      D:\TEST\App\MyApp.exe:2644
        (TRA_1596, READ_COMMITTED | REC_VERSION | WAIT | READ_WRITE)
      BI_TRIGGER_001 FOR TABLE_001 (BEFORE INSERT)

2014-05-28T11:21:03.7680 (5776:0000ED5470) EXECUTE_TRIGGER_FINISH
      TEST_DB (ATT_10, SERVER:NONE, ISO88591, TCPv4:192.168.1.5)
      D:\TEST\App\MyApp.exe:2644
        (TRA_1596, READ_COMMITTED | REC_VERSION | WAIT | READ_WRITE)
      BI_TRIGGER_001 FOR TABLE_001 (BEFORE INSERT)
    0 ms, 1 fetch(es), 1 mark(s)
2014-05-28T11:21:03.7680 (5776:00000ED5470) EXECUTE_PROCEDURE_FINISH
      TEST_DB (ATT_10, SERVER:NONE, ISO88591, TCPv4:192.168.1.5)
      D:\TEST\App\MyApp.exe:2644
        (TRA_1596, READ_COMMITTED | REC_VERSION | WAIT | READ_WRITE)

Procedure PROC_001:
param0 = varchar(50), "758755"
param1 = varchar(10), "LIL"

    0 ms
Basically the same thing that's written to firebird.log with some additinal information.
2014-09-24T13:58:48.7230 (2453:04910) ERROR AT jrd8_attach_database
      /home/db/BADDB.FDB (ATT_0, sysdba, NONE, TCPv4:127.0.0.1)
      /opt/firebird/bin/isql:8174
335544335 : database file appears corrupt (/home/db/BADDB.FDB)
335544650 : wrong page type
335544403 : page 0 is of wrong type (expected 3, found 1)
2014-09-24T13:49:17.1970 (2453:0x7fed02a04910) SWEEP_START
      /home/db.fdb (ATT_127, SYSDBA:NONE, NONE, TCPv4:127.0.0.1)
      /opt/firebird/bin/gfix:7892

Transaction counters:
      Oldest interesting       1063
      Oldest active            1064
      Oldest snapshot          1064
      Next transaction         1065

2014-09-24T13:49:17.2240 (2453:0x7fed02a04910) SWEEP_PROGRESS
      /home/db.fdb (ATT_127, SYSDBA:NONE, NONE, TCPv4:127.0.0.1)
      /opt/firebird/bin/gfix:7892
    0 ms, 5 fetch(es)
You will never need those unless you're Firebird core developer or GPRE user.
Note: BLR & DYN records could be quite long, so set max_blr_length & max_dyn_length trace options accordingly.
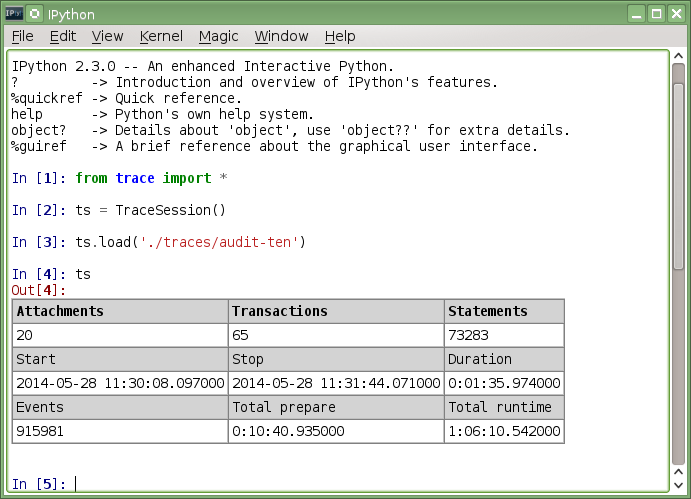
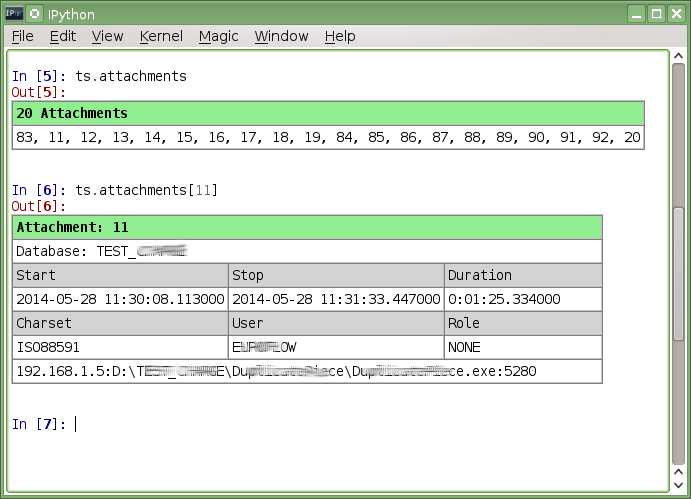
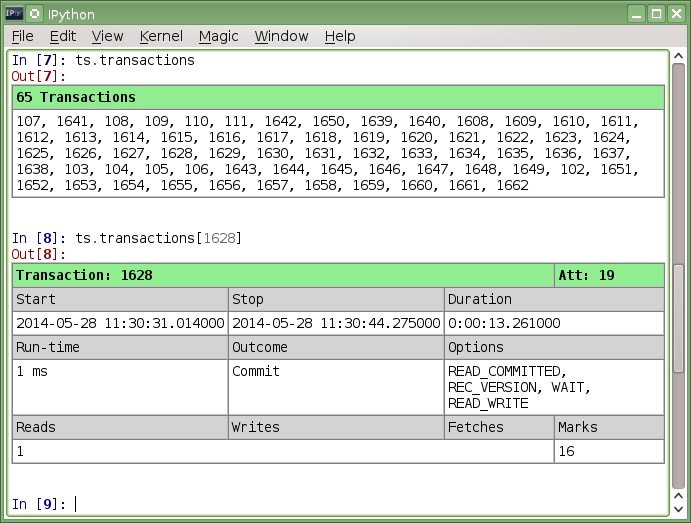
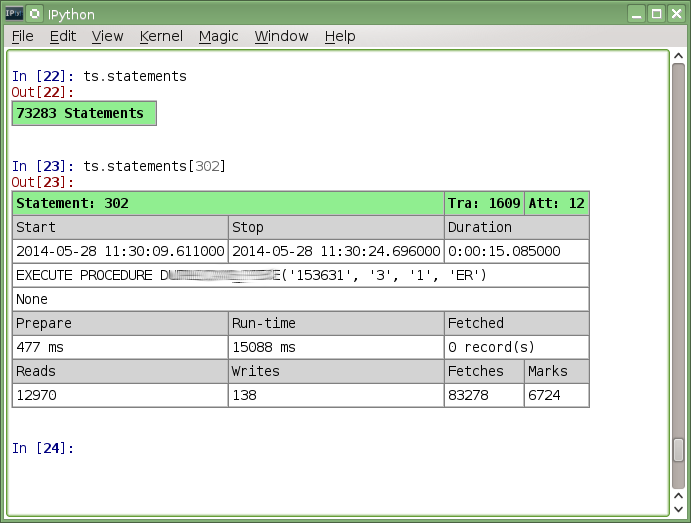
In Python it's piece of cake:
- FDB provides convenient access to Firebird Services, including work with user trace sessions
- Python is great for work with any kind of data (scientists love it for good reasons)
Example:
Configurable CLI application that collects execution PLANs over time and creates report of usage frequency and list of used / unused indices has only 115 lines of Python code.
strace is universal tool for User Trace logging to screen or text file for later processing.
usage: strace.py [-h] [-o HOST] [-u USER] [-p PASSWORD] [-i INCLUDE]
  [-e EXCLUDE] [--connections] [--transactions]
  [--statements {prepare,plan,start,finish,free} [{prepare,plan,start,finish,free} ...]]
  [--procedures {start,finish} [{start,finish} ...]]
  [--triggers {start,finish} [{start,finish} ...]] [--perf]
  [--context] [--errors] [--sweep] [--blr] [--blr-requests]
  [--dyn] [--dyn-requests] [--time-threshold TIME_THRESHOLD]
  [--max-sql-length MAX_SQL_LENGTH]
  [--max-blr-length MAX_BLR_LENGTH]
  [--max-dyn-length MAX_DYN_LENGTH]
  [--max-arg-length MAX_ARG_LENGTH]
  [--max-arg-count MAX_ARG_COUNT]
  database [FILENAME]
You can't easily stop code that runs user trace session. Best way is to use other process to stop it.
mtrace can list, suspend, resume or stop user trace sessions.
usage: mtrace.py [-h] [-o HOST] [-u USER] [-p PASSWORD] [-l]
                 [-s SESSION_ID] [-r SESSION_ID] [-c SESSION_ID]
Example Audit log: